Can I Be a Foster Parent With a Felony?
Yes, only violent, sexual and child abuse crimes will be automatic disqualifiers.
 Written by Background Check Repair
Criminal Records | April 29, 2024
Table of Contents
How many foster parents are there with criminal records in the U.S.?
The latest statistics show that the number of children in foster care is steadily declining, but there are still thousands of children that are looking for permanent homes.
But, many people are surprised to learn that there are foster parents with criminal records, since criminal history information is generally taken on a case-by-case basis when states determine foster parent eligibility.
This complete guide outlines how many foster parents are there with criminal records, as well as a number of other facts about current foster parents in the U.S. as well as how to undergo a foster parent background check.
Many individuals have no idea how many children there are in the foster care system in the U.S. making questions like, how many foster parents are there, quite common.
Numbers change every year but the most recent numbers from Who Cares,1 show that the total of licensed foster homes has been dropping steadily over the last few years, with about 214,000 officially licensed homes as of 2020.
The average length of foster care placement is a major cause for concern with social services. With all children, the goal is to find the child a permanent home as quickly as possible and to prevent them from moving from one foster care home to another.
On average social services estimates that most children will be in foster care between 6 and 18 months, however, it can be far longer or shorter, depending on a variety of factors.
The chart shows how long children tend to spend in foster care.
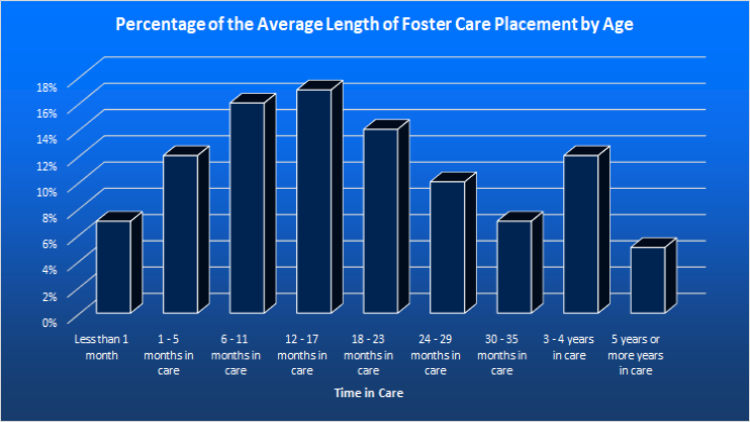
| Time in Care | Percent of Total Foster Children |
| Less than 1 month | 7% of total children |
| 1 – 5 months in care | 12% of total children |
| 6 – 11 months in care | 16% of total children |
| 12 – 17 months in care | 17% of total children |
| 18 – 23 months in care | 14% of total children |
| 24 – 29 months in care | 10% of total children |
| 30 – 35 months in care | 7% of total children |
| 3 – 4 years in care | 12% of total children |
| 5 years or more years in care | 5% of total children |
The average age that children leave foster care is another common cause for discussion.
The attached chart shows the average age that children leave foster care for a permanent living arrangement in the United States.
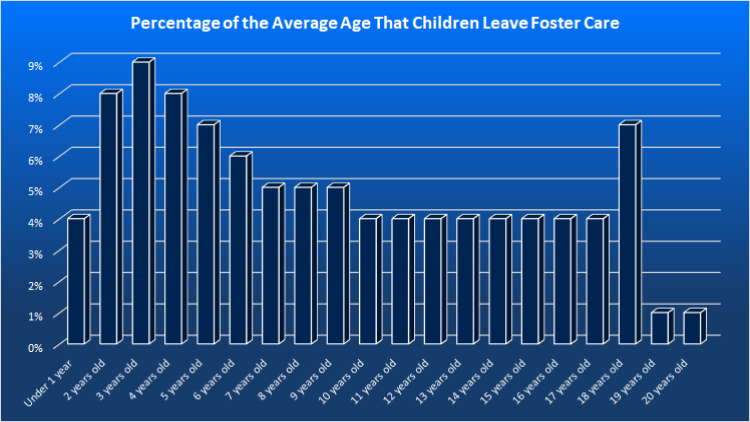
| Age at Exit | Percent of Children in Foster Care |
| Under 1 year | 4% of total children |
| 2 years old | 8% of total children |
| 3 years old | 9% of total children |
| 4 years old | 8% of total children |
| 5 years old | 7% of total children |
| 6 years old | 6% of total children |
| 7 years old | 5% of total children |
| 8 years old | 5% of total children |
| 9 years old | 5% of total children |
| 10 years old | 4% of total children |
| 11 years old | 4% of total children |
| 12 years old | 4% of total children |
| 13 years old | 4% of total children |
| 14 years old | 4% of total children |
| 15 years old | 4% of total children |
| 16 years old | 4% of total children |
| 17 years old | 4% of total children |
| 18 years old | 7% of total children |
| 19 years old | 1% of total children |
| 20 years old | 1% of total children |
Many individuals who are considering foster care and asking questions like how many foster parents are there, may have grown concerned upon seeing foster care trauma statistics.
Although there is significant evidence that an extremely high number of children in foster care have been victims of abuse and other forms of trauma, there is little reliable data on the matter.
Not only would this data need to be gathered on children, but there is also the issue of when the trauma occurred: Before or during their time in foster care.
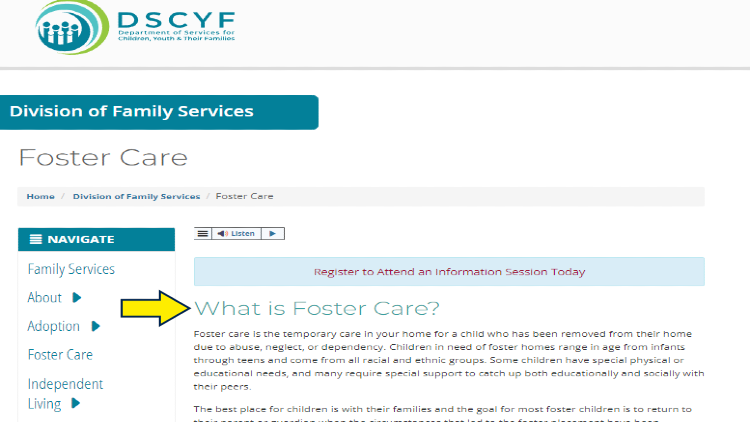
Foster care provides a temporary living arrangement for children who need to be placed away from their home to protect them from danger or abuse.
However, when it comes to the number of traumatic experiences among children in foster care, studies have shown that a significant amount of children have had above-average exposure to traumatic experiences.
Much of this trauma is related to the reason that the child ended up in foster care at all, for example, parental substance abuse and physical abuse of the child are one of the most common reasons for a child to enter foster care.
When it comes to foster care statistics by state, many individuals will be surprised at the vast differences in the rate of foster care from state to state.
Currently, Alaska, Montana, and West Virginia have the highest number of children in foster care as a percentage of the total child population in the state.
Individuals can use the table below to look at the foster care statistics by state.
The number of children in foster care by state includes individuals who were in foster care for any amount of time and includes individuals up to the age of 20. Data was gathered from Who Cares.1
| Number of Children in Foster Care by State | Total Children in Foster Care as of 2021 | Foster Care Rate |
| Alabama | 5,692 children currently in foster care | 4-6 children in foster care per 1000 |
| Alaska | 3,556 children currently in foster care | 12-14 children in foster care per 1000 |
| Arizona | 14,682 children currently in foster care | 8-10 children in foster care per 1000 |
| Arkansas | 4,721 children currently in foster care | 4-6 children in foster care per 1000 |
| California | 49,118 children currently in foster care | 4-6 children in foster care per 1000 |
| Colorado | 4,019 children currently in foster care | 2-4 children in foster care per 1000 |
| Connecticut | 3,966 children currently in foster care | 4-6 children in foster care per 1000 |
| Delaware | 451 children currently in foster care | 2-4 children in foster care per 1000 |
| Florida | 23,229 children currently in foster care | 4-6 children in foster care per 1000 |
| Georgia | 11,893 children currently in foster care | 4-6 children in foster care per 1000 |
| Hawaii | 1,433 children currently in foster care | 4-6 children in foster care per 1000 |
| Idaho | 1,585 children currently in foster care | 2-4 children in foster care per 1000 |
| Illinois | 21,210 children currently in foster care | 4-6 children in foster care per 1000 |
| Indiana | 11,872 children currently in foster care | 10-12 children in foster care per 1000 |
| Iowa | 5,987 children currently in foster care | 8-10 children in foster care per 1000 |
| Kansas | 6,896 children currently in foster care | 10-12 children in foster care per 1000 |
| Kentucky | 9,145 children currently in foster care | 8-10 children in foster care per 1000 |
| Louisiana | 3,399 children currently in foster care | 2-4 children in foster care per 1000 |
| Maine | 2,197 children currently in foster care | 8-10 children in foster care per 1000 |
| Maryland | 4,836 children currently in foster care | 2-4 children in foster care per 1000 |
| Massachusetts | 9,134 children currently in foster care | 6-8 children in foster care per 1000 |
| Michigan | 12,590 children currently in foster care | 4-6 children in foster care per 1000 |
| Minnesota | 7,717 children currently in foster care | 6-8 children in foster care per 1000 |
| Mississippi | 3,728 children currently in foster care | 4-6 children in foster care per 1000 |
| Missouri | 13,939 children currently in foster care | 8-10 children in foster care per 1000 |
| Montana | 3,223 children currently in foster care | 12-14 children in foster care per 1000 |
| Nebraska | 3,230 children currently in foster care | 6-8 children in foster care per 1000 |
| Nevada | 4,306 children currently in foster care | 6-8 children in foster care per 1000 |
| New Hampshire | 1,442 children currently in foster care | 4-6 children in foster care per 1000 |
| New Jersey | 3,723 children currently in foster care | 2-4 children in foster care per 1000 |
| New Mexico | 1,918 children currently in foster care | 4-6 children in foster care per 1000 |
| New York | 15,332 children currently in foster care | 2-4 children in foster care per 1000 |
| North Carolina | 11,213 children currently in foster care | 4-6 children in foster care per 1000 |
| North Dakota | 1,570 children currently in foster care | 8-10 children in foster care per 1000 |
| Ohio | 15,280 children currently in foster care | 6-8 children in foster care per 1000 |
| Oklahoma | 7,842 children currently in foster care | 8-10 children in foster care per 1000 |
| Oregon | 5,561 children currently in foster care | 6-8 children in foster care per 1000 |
| Pennsylvania | 13,564 children currently in foster care | 4-6 children in foster care per 1000 |
| Rhode Island | 1,956 children currently in foster care | 10-12 children in foster care per 1000 |
| South Carolina | 4,145 children currently in foster care | 4-6 children in foster care per 1000 |
| South Dakota | 929 children currently in foster care | 6-8 children in foster care per 1000 |
| Tennessee | 8,774 children currently in foster care | 4-6 children in foster care per 1000 |
| Texas | 28,261 children currently in foster care | 4-6 children in foster care per 1000 |
| Utah | 2,250 children currently in foster care | 2-4 children in foster care per 1000 |
| Vermont | 1,079 children currently in foster care | 10-12 children in foster care per 1000 |
| Virginia | 5,254 children currently in foster care | 2-4 children in foster care per 1000 |
| Washington | 7,802 children currently in foster care | 6-8 children in foster care per 1000 |
| West Virginia | 6,940 children currently in foster care | 12-14 children in foster care per 1000 |
| Wisconsin | 7,109 children currently in foster care | 4-6 children in foster care per 1000 |
| Wyoming | 1,098 children currently in foster care | 6-8 children in foster care per 1000 |
Many individuals are curious about how many foster families are there in the US. As expected, there are fewer foster families nationwide than there are foster children.
Although this may seem especially concerning, keep in mind that many foster families will take in multiple children when possible.
| Licensed Foster Homes by State | Number of Licensed Homes |
| Alabama | 2,039 Licensed foster care homes |
| Alaska | 1,205 Licensed foster care homes |
| Arizona | 3,509 Licensed foster care homes |
| Arkansas | 1,509 Licensed foster care homes |
| California | 32,597 Licensed foster care homes |
| Colorado | 1,586 Licensed foster care homes |
| Connecticut | 2,842 Licensed foster care homes |
| Delaware | 400 Licensed foster care homes |
| Florida | 8,867 Licensed foster care homes |
| Georgia | 4,650 Licensed foster care homes |
| Hawaii | 1,186 Licensed foster care homes |
| Idaho | 1,131 Licensed foster care homes |
| Illinois | 9,058 Licensed foster care homes |
| Indiana | 5,428 Licensed foster care homes |
| Iowa | 2,223 Licensed foster care homes |
| Kansas | 2,805 Licensed foster care homes |
| Kentucky | 5,679 Licensed foster care homes |
| Louisiana | 1,834 Licensed foster care homes |
| Maine | 1,717 Licensed foster care homes |
| Maryland | 3,267 Licensed foster care homes |
| Massachusetts | 5,919 Licensed foster care homes |
| Michigan | 5,434 Licensed foster care homes |
| Minnesota | 4,287 Licensed foster care homes |
| Mississippi | 1,870 Licensed foster care homes |
| Missouri | 4,971 Licensed foster care homes |
| Montana | 1,674 Licensed foster care homes |
| Nebraska | 1,502 Licensed foster care homes |
| Nevada | 1,441 Licensed foster care homes |
| New Hampshire | 708 Licensed foster care homes |
| New Jersey | 3,467 Licensed foster care homes |
| New Mexico | 1,383 Licensed foster care homes |
| New York | 11,197 Licensed foster care homes |
| North Carolina | 7,052 Licensed foster care homes |
| North Dakota | 953 Licensed foster care homes |
| Ohio | 8,167 Licensed foster care homes |
| Oklahoma | 4,958 Licensed foster care homes |
| Oregon | 3,805 Licensed foster care homes |
| Pennsylvania | 12,970 Licensed foster care homes |
| Rhode Island | 1,292 Licensed foster care homes |
| South Carolina | 3,040 Licensed foster care homes |
| South Dakota | 828 Licensed foster care homes |
| Tennessee | 5,175 Licensed foster care homes |
| Texas | 11,583 Licensed foster care homes |
| Utah | 1,476 Licensed foster care homes |
| Vermont | 1,299 Licensed foster care homes |
| Virginia | No data collected |
| Washington | 4,831 Licensed foster care homes |
| West Virginia | 3,431 Licensed foster care homes |
| Wisconsin | 2,488 Licensed foster care homes |
| Wyoming | 447 Licensed foster care homes |
Those looking for U.S. foster care system statistics will likely be able to find a fair amount of information gathered by private and nonprofit agencies.
Although some information is difficult to obtain, these organizations have gathered tons of information that can help to confront important issues facing the foster care system.
Many individuals will have heard that a significant amount of children will simply become too old to be in foster care and will want to know about aging out of foster care statistics.
Although no data is gathered on this issue by official agencies, the Annie E. Casey Foundation estimates that around 26,000 children simply age out of foster care every year. Many of these individuals will end up homeless.
Another common question individuals have about foster care in the US is in regard to foster parent demographics and religion.
Unfortunately, there is almost no useful data regarding religion, ethnicity, age, or any other information regarding foster parents. This is due to the fact that most of the individuals who are foster parents, do so privately.
Similar to demographic data of foster parents, there are very few reputable sources for abuse in foster care statistics. However, there are plenty of organizations and agencies, such as the CDC that gather data on child abuse statistics in the country.
Examining children in foster care statistics can help social services ultimately limit the number of children that are displaced from their homes by examining risk behaviors and implementing services to help children and parents exhibiting high-risk behaviors.
Individuals can use the tables below to examine foster care statistics in the U.S. by various demographics. Data was gathered by the Administration of Children and Families.
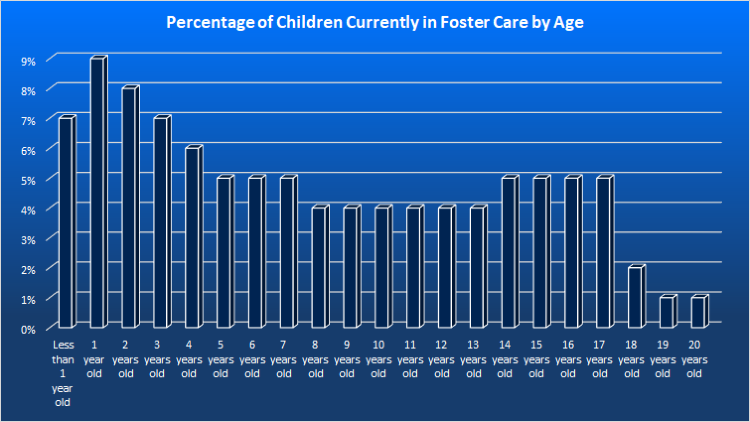
| Age | Percent of Those Currently in Foster Care |
| Less than 1 year old | 7% of total children in foster care |
| 1 year old | 9% of total children in foster care |
| 2 years old | 8% of total children in foster care |
| 3 years old | 7% of total children in foster care |
| 4 years old | 6% of total children in foster care |
| 5 years old | 5% of total children in foster care |
| 6 years old | 5% of total children in foster care |
| 7 years old | 5% of total children in foster care |
| 8 years old | 4% of total children in foster care |
| 9 years old | 4% of total children in foster care |
| 10 years old | 4% of total children in foster care |
| 11 years old | 4% of total children in foster care |
| 12 years old | 4% of total children in foster care |
| 13 years old | 4% of total children in foster care |
| 14 years old | 5% of total children in foster care |
| 15 years old | 5% of total children in foster care |
| 16 years old | 5% of total children in foster care |
| 17 years old | 5% of total children in foster care |
| 18 years old | 2% of total children in foster care |
| 19 years old | 1% of total children in foster care |
| 20 years old | 1% of total children in foster care |
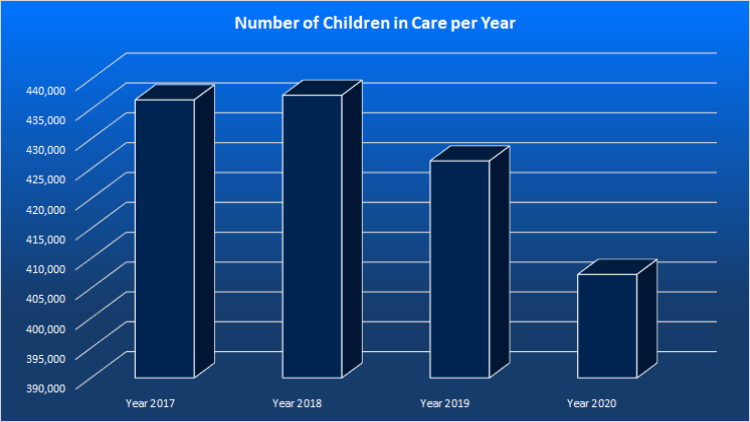
| Year | Number of children in care |
| 2017 | 436,556 children in foster care |
| 2018 | 437,337 children in foster care |
| 2019 | 426,325 children in foster care |
| 2020 | 407,318 children in foster care |
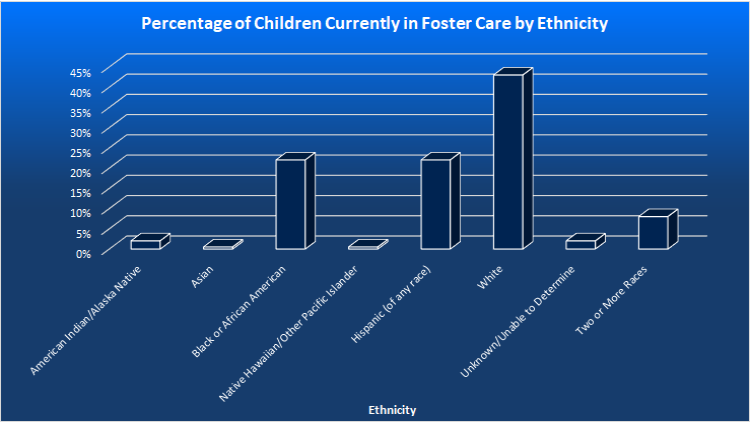
| Ethnicity | Percent |
| American Indian/Alaska Native | 2% of children in foster care |
| Asian | 1% of children in foster care |
| Black or African American | 22% of children in foster care |
| Native Hawaiian/Other Pacific Islander | 0.5% of children in foster care |
| Hispanic (of any race) | 22% of children in foster care |
| White | 43% of children in foster care |
| Unknown/Unable to Determine | 2% of children in foster care |
| Two or More Races | 8% of children in foster care |
When it comes to how many babies are given up for adoption each year, the most accurate data will examine the average age of individuals entering foster care each year.
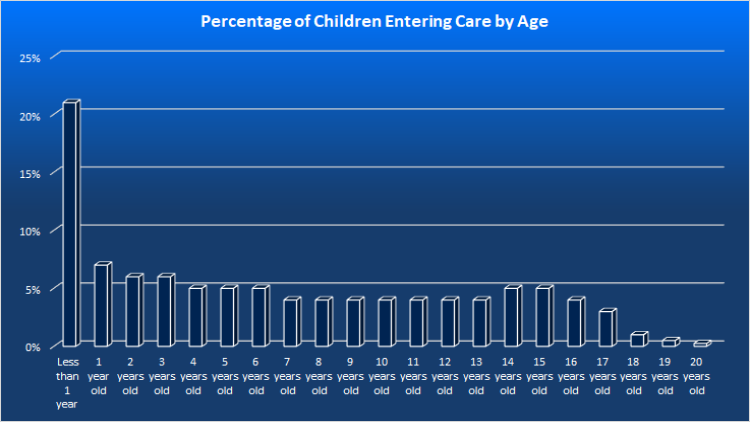
| Age When Entering Care | Percent of Children Entering Care |
| Less than 1 year | 21% of children entering foster care |
| 1 year old | 7% of children entering foster care |
| 2 years old | 6% of children entering foster care |
| 3 years old | 6% of children entering foster care |
| 4 years old | 5% of children entering foster care |
| 5 years old | 5% of children entering foster care |
| 6 years old | 5% of children entering foster care |
| 7 years old | 4% of children entering foster care |
| 8 years old | 4% of children entering foster care |
| 9 years old | 4% of children entering foster care |
| 10 years old | 4% of children entering foster care |
| 11 years old | 4% of children entering foster care |
| 12 years old | 4% of children entering foster care |
| 13 years old | 4% of children entering foster care |
| 14 years old | 5% of children entering foster care |
| 15 years old | 5% of children entering foster care |
| 16 years old | 4% of children entering foster care |
| 17 years old | 3% of children entering foster care |
| 18 years old | 1% of children entering foster care |
| 19 years old | 0.5% of children entering foster care |
| 20 years old | 0.25% of children entering foster care |
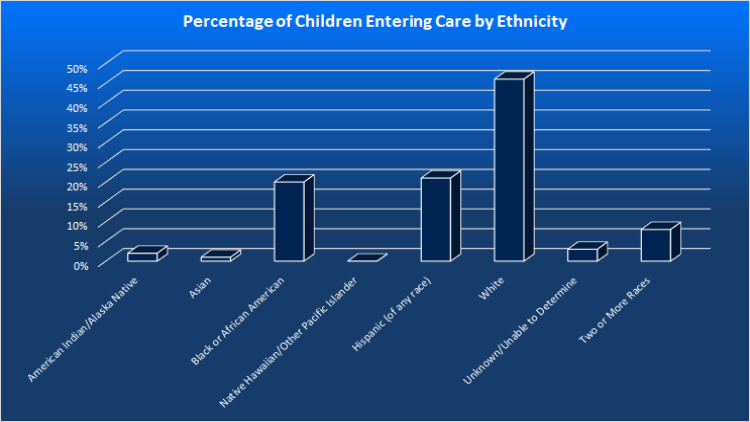
| Ethnicity | Percent Entering Care |
| American Indian/Alaska Native | 2% of children entering care |
| Asian | 1% of children entering care |
| Black or African American | 20% of children entering care |
| Native Hawaiian/Other Pacific Islander | 0% of children entering care |
| Hispanic (of any race) | 21% of children entering care |
| White | 46% of children entering care |
| Unknown/Unable to Determine | 3% of children entering care |
| Two or More Races | 8% of children entering care |
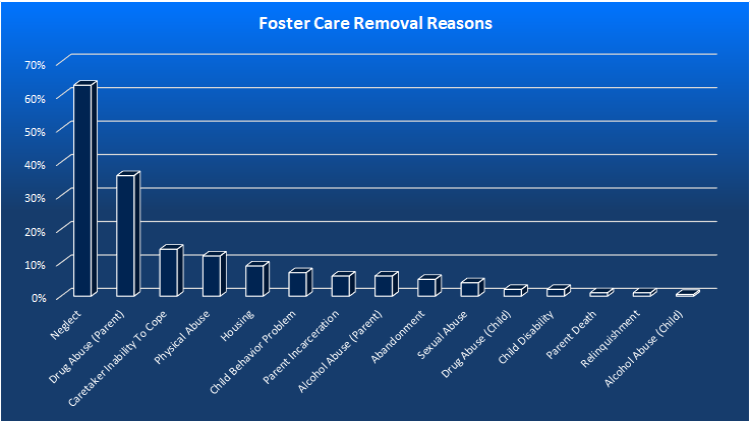
| Reason for Removal From Household | Percent |
| Neglect | 63% of children in foster care |
| Drug Abuse (Parent) | 36% of children in foster care |
| Caretaker Inability To Cope | 14% of children in foster care |
| Physical Abuse | 12% of children in foster care |
| Housing | 9% of children in foster care |
| Child Behavior Problem | 7% of children in foster care |
| Parent Incarceration | 6% of children in foster care |
| Alcohol Abuse (Parent) | 6% of children in foster care |
| Abandonment | 5% of children in foster care |
| Sexual Abuse | 4% of children in foster care |
| Drug Abuse (Child) | 2% of children in foster care |
| Child Disability | 2% of children in foster care |
| Parent Death | 1% of children in foster care |
| Relinquishment | 1% of children in foster care |
| Alcohol Abuse (Child) | 0.5% of children in foster care |
Gathering data for how many babies are put up for adoption each year worldwide is extremely difficult. Not only do many countries not keep track of this data, among countries that do, but it can also be hard to verify their exact methodology for gathering the data.
However, data gathered by UNICEF estimates that there are approximately 18.5 million children worldwide that have lost both parents.
Perhaps the most common question that individuals who are considering fostering a child will have is about the foster parent background check, and what it entails.
The foster parent background check is fairly straightforward but does involve more checks than many individuals will be used to. Especially those that are only familiar with what appears on a background check for employment.
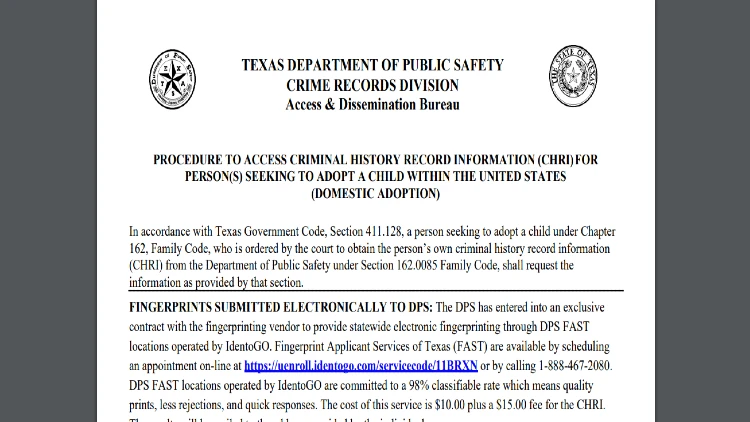
Parents who are interested in creating a foster home to help children must undergo a fingerprint background check that examines criminal history as well as other information.
The type of checks that must be performed on all prospective foster parents is mandated at both the state and federal levels.
The check for foster parents falls under the same laws that govern all childcare background checks, which is required of any individual who will have unsupervised access to children in an official capacity. This includes child abuse background checks, a background check on teachers, school bus drivers, school administration, foster parents, and more.
The checks required by the federal government cover what kind of checks need to be performed, who they need to be performed on, and how often they need to be performed.
Anyone will have unsupervised access to children will need a childcare background check.
When it comes to foster parents this is especially important. Not only will the foster parents themselves need to undergo and pass the different types of background checks required to qualify, but any other residents in the home over the age of 16 will also need to undergo a check as well.
Federal laws mandate that individuals in the childcare industry, including foster, care parents will need to undergo a background check at least every 5 years.
However, when it comes to differences between state and federal childcare background checks this is the most common place where individuals will notice slight differences. Many states have passed laws that require individuals to undergo checks every 3 years instead of 5.
Individuals should always check their local laws before assuming the check is every 5 years.
When it comes to federal laws for child care or foster care background checks, the following checks will need to be performed at a minimum. Keep in mind that every state implements these laws slightly differently and some states may require additional checks.
Individuals who have questions about the background check or related process can check the website of the U.S. Department of Health and Human Services for more information.
When it comes to the common question of, whether can felons be foster parents, the answer might surprise a lot of people. Individuals will not be disqualified from being foster parents for simply having a felony conviction on their record.
However, not all felony convictions will be overlooked and any criminal history information will factor into the final decision.
The main crimes that are considered automatic disqualifiers are what most individuals would expect. The following crimes will immediately disqualify an individual from being a foster parent.
Keep in mind that the child care background check will cover an individual’s entire criminal history, so individuals who have committed the following crimes will be barred from becoming foster parents for life.
There are numerous government and private organizations that gather valuable data on foster parents and foster children in the United States. Foster parent statistics have shown numerous reassuring trends.
For example, the total number of children in foster care has been steadily declining over the last 5 years.
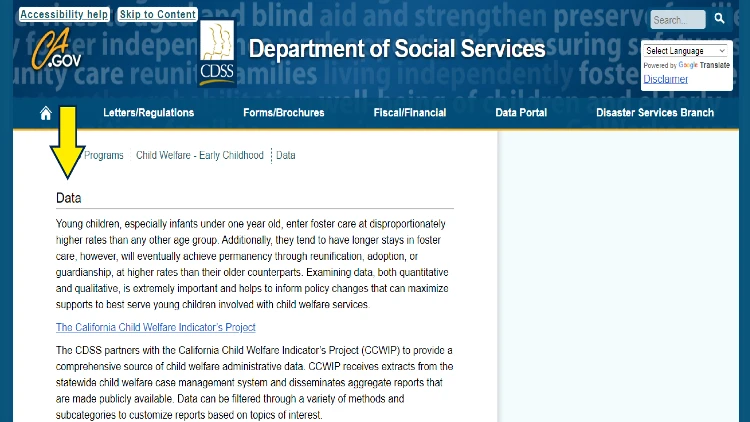
California’s Department of Social Services explains that the statistics in the Child Welfare Indicator Project tracks the information needed to make the program better and more effective at reuniting families when possible.
Looking at these statistics can also help to identify trends that may have a higher chance of leading to a child entering foster care as well as examine foster care numbers across different ethnicity statistics and states.
When it comes to can a foster child live with a felon, the answer is usually yes. Unless the parent has been convicted of a violent crime, sex crime, or any crime relating to child abuse, then they will not be disqualified by their criminal history.
However, the foster parent process is fairly intensive and there are many factors that are considered before social services will allow an individual to become a foster parent.
Another thing that individuals should consider is that it’s not just the foster parent or parents themselves that will need to undergo a background check and not have certain felonies on their record. Any resident of the home will be subject to the same check and have the same disqualifiers.
Some individuals might have heard the term non-offending parent in regard to a CPS case and will be wondering what is considered a non-offending parent. The answer doesn’t necessarily involve who is at fault, only who CPS is formally investigating.
In a two-parent household, the non-offending parent is the one that is not under investigation.
Being the non-offending parent in CPS case can be a very uncomfortable and potentially volatile situation to be in.
Individuals should understand their legal rights as non-offending parents and should try to contact a lawyer as soon as possible. This will greatly increase the chances of the child staying with the non-offending parent.
CPS cases can be extremely complicated and legal counsel will be an invaluable asset to have.
When it comes to how many foster parents there are, individuals should know that the number of foster parents tends to rise with the number of foster children. Many of these parents will be fostering multiple children at a time, and others may go long periods of time without fostering any.
Individuals who are interested in adoption should contact their local state resources to learn about eligibility.
Deciding whether or not to adopt or become a foster parent is a huge decision. Individuals should always do as much research on their state’s adoption statistics so they can have a better idea of the extent of the foster child problems in the U.S. and be able to answer questions like How many foster parents are there?
Yes, only violent, sexual and child abuse crimes will be automatic disqualifiers.
As of 2020 there were approximately 214,000 licensed foster care parents in the United States.
Numbers vary by the day but the most recent estimates is that there are currently over 407,000 children actively in foster care in the United States.
Abuse and neglect statistics amongst foster children is notoriously difficult to obtain. However, the Annie E. Casey foundation estimates that 8 out of every 1000 children in the use are abused or neglected at some point in their childhood.
According to a study, practicing Christians are more likely to consider fostering or adopting than the public.
The state of Delaware currently has the lowest foster care rate in the U.S.
Generally, there are far more potential adoptive parents than there are babies put up for adoption. Almost all babies put up for adoption in the U.S. will eventually be adopted.
Foster care rates by state vary widely. Currently, Delaware has the lowest rate of children in foster care while Montana has the highest.
There are currently over 400,000 children in foster care in the U.S.
Most individuals choose to become foster parents privately so there is no reliable data on foster parents demographics.
There are an estimated 250,000 babies entering foster care each year in the United States.
1The Imprint. (2022). Youth in Care 2011-2022. Who Cares: A National Count of Foster Homes and Families. Retrieved November 04, 2022, from <https://www.fostercarecapacity.com/data/youth-in-care>
We use cookies to ensure that we give you the best experience on our website. If you continue to use this site we will assume that you are happy with it