Crime record statistics are an excellent tool to use to help dictate legal policy and determine societal norms.
But, there are a lot of public records available, and many people who are interested in learning more don’t always know where to start.
When facing a background check for the first time, many applicants ask what the criminal record employment statistics. So, instead of search through every state and federal database, this guide outlines the biggest and (perhaps) most surprising crime record statistics to examine according to various conditions, such as employment, race, types of crimes, DACA and more.
Keep reading to discover these interesting and eye-opening criminal record statistics and view tabled data from different perspectives.
USA Criminal Record Statistics
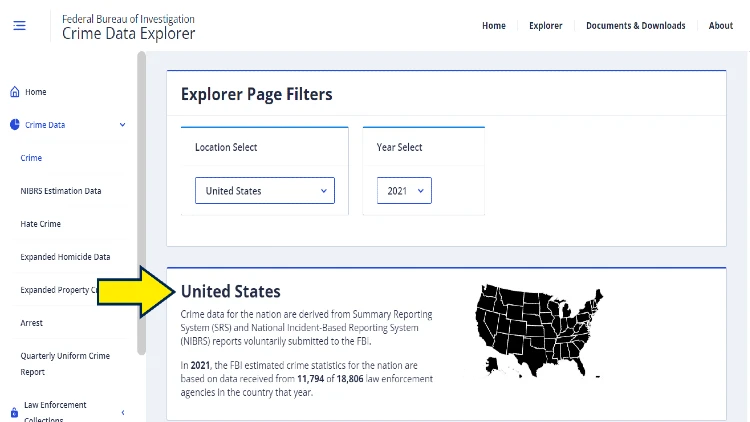
Looking at USA criminal record statistics in many different ways is critical to understanding where this country stands in the global picture of criminal activity and criminal justice. The US is the middle of the road for several important crime statistics.
With an overall crime rate of 47.81 incidences per 100,000 population, the US far surpasses countries such as Canada (41.89/100,000), Australia (43.03/100,000), and Germany (35.79/100,000).
Conversely, the US crime rate is eclipsed by many other countries, such as Bangladesh (63.9/100,000), South Africa (76.86/100,000), and Venezuela (83.76/100,000).27
The United Nations Office on Drugs and Crime retains data on intentional homicide and found that the US homicide rate of 4.96/100,000 population was much higher than rates in countries such as Italy (.57/100,000), the UK (1.12/100,000), and Egypt (2.55/100,000) but significantly lower than the African country of Nigeria (34.52/100,000) or South American country of Venezuela (36.69/100,000).21
Although the US criminal record statistics may not appear that alarming from a global perspective, a closer look can reveal some disturbing trends in criminal data.
Moreover, the country as a whole (U.S.) sees the vast majority of crime happening in large cities.
General Criminal Record Statistics
In terms of general criminal record statistics, approximately 30% of adult Americans have some sort of criminal record.2 Of reported crimes across the nation, the vast majority are property crimes.
The top 3 criminal convictions in the United States are larceny/theft (60% of all crimes), burglary (18%), and motor vehicle theft (10%).8
Misdemeanor Statistics
Criminal offenses are typically grouped into two categories: misdemeanor offenses (loosely defined as a minor offense with a maximum sentence between 1 day and 1 year in jail) and felony offenses (loosely defined as serious offenses with a maximum sentence of death or imprisonment >1 year).18,25
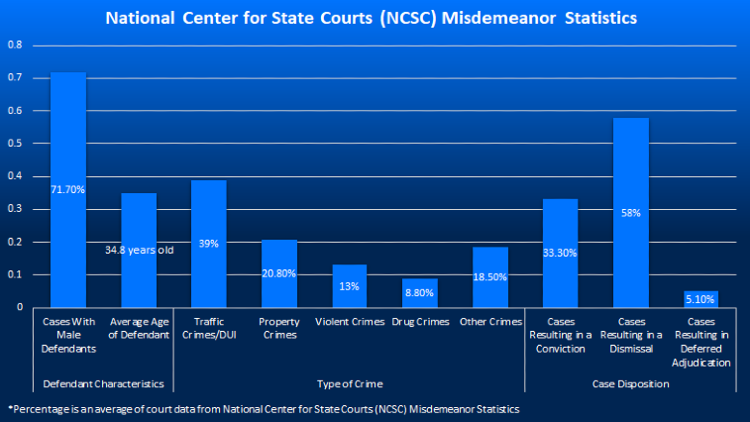
Misdemeanor crimes comprise more than 80% of all criminal cases processed in the country, and misdemeanor statistics, though notably limited, is an important area to investigate.1
| Table 1 | National Center for State Courts (NCSC) Misdemeanor Statistics |
| Defendant Characteristics | Cases With Male Defendants | 71.7%** |
| Average Age of Defendant | 34.8 yrs |
| Type of Crime | Traffic Crimes/DUI | 39%** |
| Property Crimes | 20.8%** |
| Violent Crimes | 13%** |
| Drug Crimes | 8.8%** |
| Other Crimes | 18.5%** |
| Case Disposition | Cases Resulting in a Conviction | 33.3%** |
| Cases Resulting in a Dismissal | 58%** |
| Cases Resulting in Deferred Adjudication | 5.1%** |
*BJS statistics from 2022 publication.
**Percentage is an average of court data.
Felony Statistics
Although felony crimes account for less than 20% of all criminal cases in the US, the more serious nature of these crimes calls for additional consideration. The felony population is arguably the biggest club no one wants to join.
Felony statistics are difficult to aggregate, as felony crimes may be prosecuted at the state or federal level and individuals incarcerated in state or federal facilities.
The five most common felony crimes in the US are:
- Drug Crimes
- Property Crimes
- DUI
- Violent Crimes
- Disorderly Conduct
For felony defendants, the bail bond often exceeds $10,000.22 The total population of U.S. citizens with a felony conviction (past or present) is estimated at around 24 million individuals.10
Crime Statistics by States
Another way to explore US criminal record statistics is to look at crime statistics by state. In general, states in the New England area tend to have lower crime rates than states in the South and Midwest.
Of all 50 states, Louisiana has the highest documented murder numbers (14.4 per 100,000 residents). This is double most other states, but Alabama is not far behind (12.9/100,000). In contrast, Maine is the state with the lowest numbers for violent crime, followed by Connecticut and New Hampshire.22
Understanding the number of felons by state is difficult, as felons can be housed in state or federal facilities depending on where the crime was processed. The states with the highest prison populations are Texas, California, Florida, Georgia, and Ohio.24,28
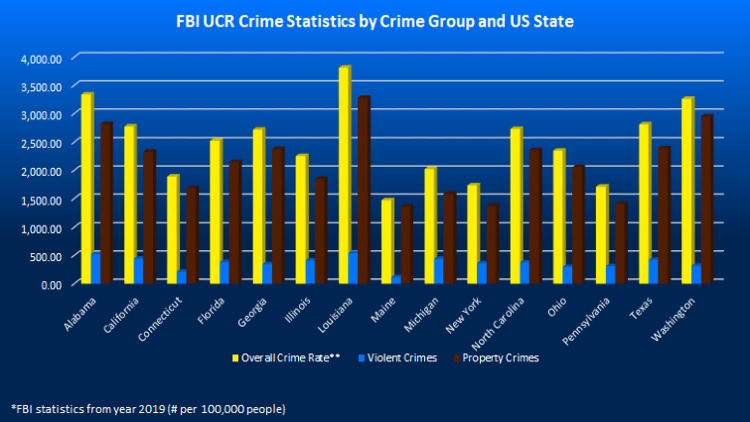
The following table looks at crime breakdown in a subset of states across the U.S.
| Table 2 | FBI UCR Crime Statistics by Crime Group and US State |
| Criminal Record Statistics by State* | Overall Crime Rate** | Violent Crimes | Property Crimes |
| Alabama | 3,336.8 | 519.6 | 2,817.2 |
| California | 2,772.4 | 441.2 | 2,331.2 |
| Connecticut | 1,888.4 | 207.4 | 1,681.0 |
| Florida | 2,524.1 | 378.4 | 2,145.7 |
| Georgia | 2,716.5 | 340.7 | 2,375.8 |
| Illinois | 2,253.4 | 406.9 | 1,846.5 |
| Louisiana | 3,813.5 | 537.5 | 3,276.0 |
| Maine | 1,469.9 | 112.1 | 1,357.8 |
| Michigan | 2,022.4 | 437.4 | 1,585.0 |
| New York | 1,731.9 | 358.6 | 1,373.3 |
| North Carolina | 2,729.1 | 371.8 | 2,357.3 |
| Ohio | 2,348.9 | 293.2 | 2,055.7 |
| Pennsylvania | 1,709.8 | 306.4 | 1,403.4 |
| Texas | 2,809.6 | 418.9 | 2,390.7 |
| Washington | 3,257.7 | 311.5 | 2,946.2 |
* FBI statistics from the year 2019 (# per 100,000 people).
**The FBI only considers violent crime and property crime data for the overall crime rate (# per 100,000 people).
Criminal Record Statistics by Race
One area of significant concern with the United States criminal justice system is its disproportionate impact on communities of color. People of color are overrepresented in the nation’s prisons: while minority groups comprise around one-third of the population, they make up two-thirds of the prison population.22
The University of South Carolina study from 2015 found that 49% of black males were arrested at least once by age 23, compared to 38% of their white peers.
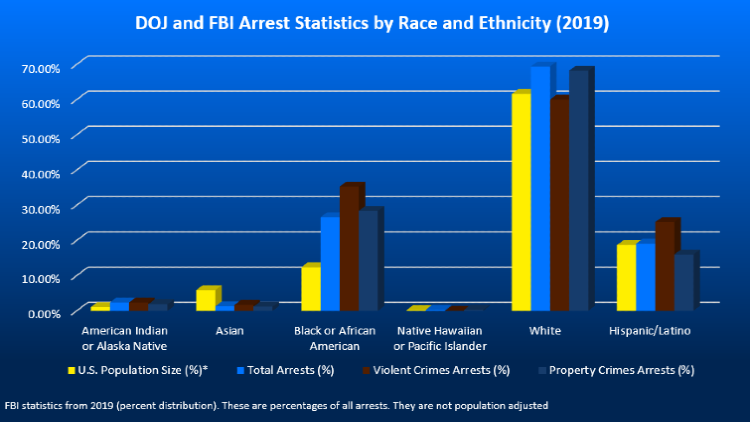
The following table examines criminal record statistics by race, exploring the breakdown of violent crime and property crime arrests by race.
| Table 3 | DOJ and FBI Arrest Statistics by Race (2019) |
| Criminal Record Statistics by Race/Ethnicity | U.S. Population Size (%)* | Total Arrests (%) | Violent Crimes Arrests (%) | Property Crimes Arrests (%) |
| Race | | | | |
| American Indian or Alaska Native | 1.1% | 6,357.1 (2.4) | 289.0 (2.4) | 512.9 (1.9) |
| Asian | 5.9% | 881.4 (1.3) | 55.5 (1.7) | 83.0 (1.2) |
| Black or African American | 12.4% | 7,246.8 (26.6) | 451.8 (35.3) | 798.5 (28.4) |
| Native Hawaiian or Pacific Islander | .2% | NA (0.3) | NA (0.6) | NA (0.3) |
| White | 61.6% | 3,265.3 (69.4) | 126.1 (60.0) | 324.7 (68.2) |
| Ethnicity | | | | |
| Hispanic/Latino | 18.7% | NA (19.1) | NA (25.2) | NA (16.0) |
*Population data from the 2020 U.S. Census.
**U.S. Department of Justice raw arrest statistics from 2019 (rate per 100,000 individuals).
***FBI statistics from 2019 (percent distribution). These are percentages of all arrests. They are not population adjusted.
Criminal Record Employment Statistics
The employment barriers facing ex-offenders are very real and can have a widespread impact on the individual’s life and community. With approximately 30% of the U.S. population living with a criminal record, the workforce and communities at large are severely impacted by employment barriers.2
As for criminal record employment statistics, more than 25% of former convicts are unemployed and individuals with violent crimes, particularly sexual offenses, in their past have the most difficulty securing employment.22
Despite that, two-thirds of polled managers who hire people with criminal records report that their quality of work is comparable to other employees without records.2 Additionally, research indicates higher rates of job retention for former convicts in many areas of the workforce, subsequently reducing the incidence of criminal behavior.15
Data from the BJS in 2018 revealed some glaring employment and recidivism statistics, showing that over 67% of released state prisoners were arrested anew within 3 years. Various studies over the last two decades have found that gainful employment reduces the risk of recidivism.11
Getting Into College With Criminal Record: Admission Statistics
Getting into college can be a challenge for anyone, and the admissions process is complex and stressful. Individuals with a criminal past face additional challenges to admission, and this section looks at how often people get into college with criminal records (admission statistics).
The Crime Awareness and Campus Security Act, passed in 1991, requires secondary education institutions to track and report campus crime and post-campus security policies and warnings.
At this time, criminal records became a more prominent determining factor in college admissions. Hundreds of universities and colleges report asking about criminal records on college applications, and the majority of these use that information to make admission decisions.
A 2009 survey of institutions across the US found that of the respondents, 66% requested criminal history information (approximately 45% through self-report and 20% through criminal background checks), and 55% reported using this information to make admission decisions.4
Violent Criminal Record Statistics
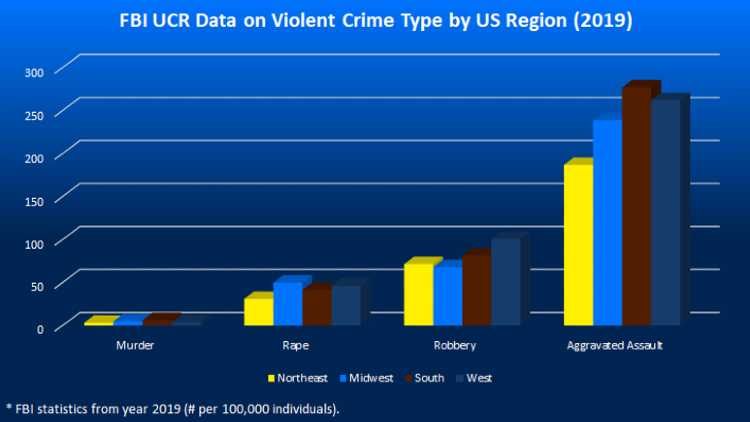
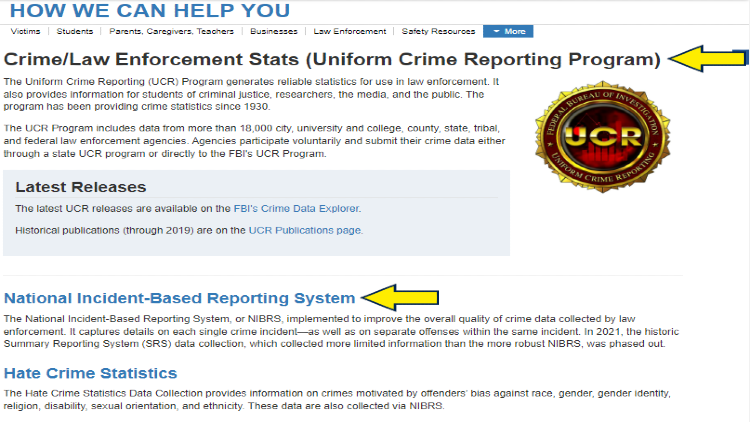
The Federal Bureau of Investigation (FBI) uses the Uniform Crime Reporting (UCR) system to collect police records of reported violent incidents. Violent crime is separated into four categories: murder/nonnegligent manslaughter, forcible rape, robbery, and aggravated assault.
The following table explores violent criminal record statistics by the US region.
| Table 4 | FBI UCR Data on Violent Crime Type by US Region (2019) |
| Types of Violent Crimes by U.S. Region | Murder | Rape | Robbery | Aggravated Assault |
| Northeast | 3.3 | 30.9 | 71.6 | 186.7 |
| Midwest | 5.0 | 49.8 | 67.9 | 239.0 |
| South | 6.4 | 41.5 | 81.7 | 277.0 |
| West | 4.1 | 46.4 | 100.7 | 262.3 |
* FBI statistics from the year 2019 (# per 100,000 individuals).
The U.S. Department of Justice (DOJ) statistics on violent crime are managed through the Bureau of Justice Statistics, which in turn stores its data sets with the National Archive of Criminal Justice Data (University of Michigan Institute for Social Research).
The DOJ uses the National Crime Victimization Survey (NCVS) to collect self-reports of violent crimes.3
A criminal and social justice issue that has become evident over time is that people of color, especially African American individuals, are disproportionately jailed and punished for criminal behavior.
Comparing the FBI’s UCR data from law enforcement with the self-report victim data from the DOJ’s NCVS can reveal some of those inequalities and injustices within the criminal justice system.
The following tables show a breakdown of violent crime arrests by race from the FBI UCR data and violent crime victim reports from the DOJ NCVS data.
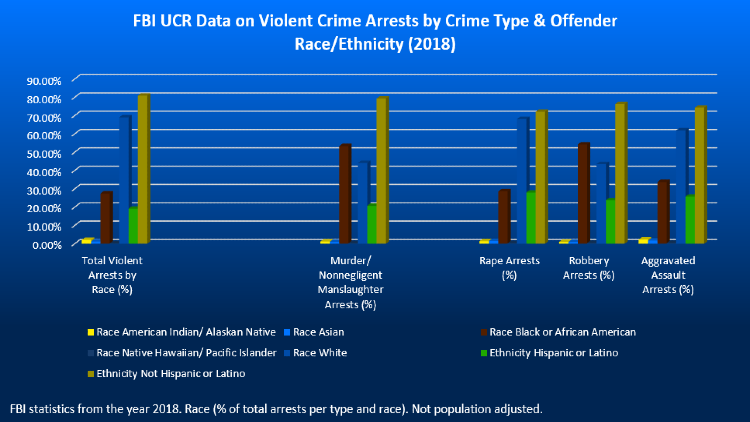
| Table 5 | FBI UCR Data on Violent Crime Arrests by Crime Type & Offender Race/Ethnicity (2018) |
| Percentage of Violent Crime Arrests by Race and Crime Type | Total Violent Arrests by Race (%) | Murder/ Nonnegligent Manslaughter Arrests (%) | Rape Arrests (%) | Robbery Arrests (%) | Aggravated Assault Arrests (%) |
| Total Violent Arrests by Type | | 8,957 | 18,776 | 66,789 | 298,040 |
| Race | 7,710,900 | | | | |
| American Indian/ Alaskan Native | 164,430 (2.1%) | 105 (1.2%) | 267 (1.4%) | 676 (1.0%) | 6,736 (2.3%) |
| Asian | 92,737 (1.2%) | 94 (1%) | 289 (1.5%) | 641 (1%) | 5,078 (1.7%) |
| Black or African American | 2,115,381 (27.4%) | 4,778 (53.3%) | 5,376 (28.6%) | 36,187 (54.2%) | 100,393 (33.7%) |
| Native Hawaiian/ Pacific Islander | 18,698 (.2%) | 27 (.3%) | 50 (.3%) | 260 (.4%) | 1,306 (.4%) |
| White | 5,319,654 (69%) | 3,953 (44.1%) | 12,794 (68.1%) | 29,025 (43.5%) | 184,527 (61.9%) |
| Ethnicity | 5,896,059 (100%) | | | | |
| Hispanic or Latino | 1,126,806 (19.1%) | 1,341 (20.7%) | 3,948 (27.9%) | 12,002 (23.7%) | 62,421 (25.7%) |
| Not Hispanic or Latino | 4,769,253 (80.9%) | 5,133 (79.3%) | 10,224 (72.1%) | 38,703 (76.3%) | 180,858 (74.3%) |
* FBI statistics from the year 2018. The total raw number of arrests per crime type and race (% of total arrests per type and race). Not population adjusted.
| Table 6 | DOJ NCVS Data – Victim Self-Report of Non-Fatal Violent Crimes [Crime Type x Offender Race/Ethnicity] (2018) |
| Victim-Reported Violent Crime Incidents | U.S. Population Size (%) | Total Violent Crimes by Race (%) | Rape Crimes (%) | RobberyCrimes (%) | Aggravated Assault Crimes (%) |
| Total Violent Crimes by Type | | 3,857,100 | | | |
| Race | | | | | |
| American Indian/ Alaskan Native** | .7% | 64,700 (1.1%) | .3% | .4% | 2% |
| Asian** | 5.7% | 78,700 (2.6%) | 4.7% | 1.9% | 1.9% |
| Black or African American | 12.5% | 980,800 (35.9%) | 22.1% | 51.1% | 33.9% |
| Hispanic | 18.3% | 560,900 (15.5%) | 15% | 15.6 | 16.6% |
| Native Hawaiian/ Pacific Islander** | .2% | 17,800 (.3%) | .5% | 0% | .3% |
| White | 60.4% | 2,250,300 (43.8%) | 55.7% | 31% | 44.8% |
*BJS statistics from 2018 (2021 report). The murder category is not included as a victim report is impossible in these cases.
** Small sample sizes in the Asian, American Indian/Alaskan Native, and Native Hawaiian/Pacific Islander groups make this data less reliable.
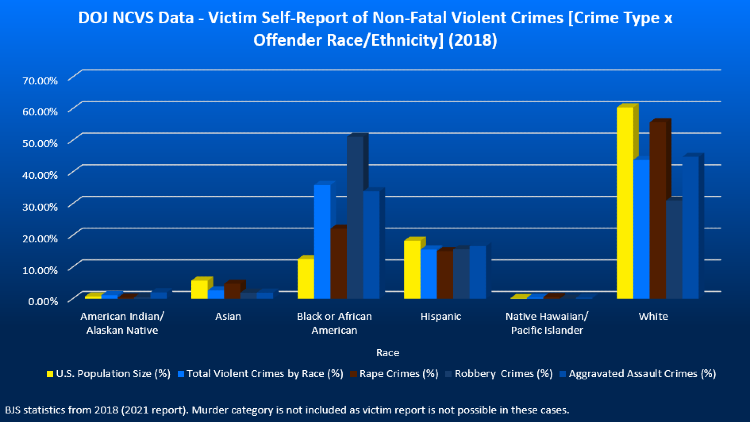
Putting the numbers in perspective, this 2018 data shows that while African Americans made up approximately 12.5% of the overall US population in that year, they were over represented in the criminal justice system with more than 35% of all self-reported violent crimes attributed to black persons and over 27% of violent crime arrests of black persons.
Furthermore, the African American population accounted for over half of all arrests for robbery and murder/non-negligent manslaughter.
Domestic Abuse Prior Criminal Record Statistic
Domestic violence is a serious concern across the nation with an estimated 35% of women and 28% of men in the US experiencing domestic violence in their lifetimes.17 Domestic violence is responsible for as much as 15% of total violent crimes, and its effect on families can be dire.20
Understanding domestic abuse prior criminal record statistics may be the key to implementing preventative measures and reducing the frequency of domestic violence.
According to a 2005 publication by the Bureau of Justice Statistics, 84% of felony domestic violence offenders had at least one prior arrest (any offense) and 73% had a prior conviction (any offense). Additionally, the BJS reports that 45% of inmates convicted of domestic/family violence had a restraining order against them at some point, and 18% had an active restraining order at the time of their incarceration.9
Some estimates indicate that over 75% of female victims of domestic violence had been abused by the same intimate partner before.17
DACA Criminal Record Statistics
The Deferred Action for Childhood Arrivals (DACA) is a federal policy that protects from deportation individuals who entered the US illegally when they were children.
According to U.S. Citizenship and Immigration Services (USCIS), a federal ruling bars the processing of new DACA applications, but more than 600,000 active DACA recipients may continue to renew their applications.6
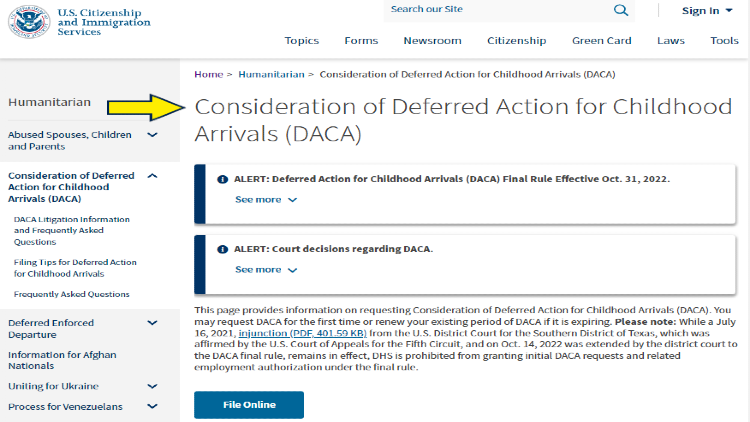
With this significant population of DACA recipients, many individuals are curious about DACA criminal record statistics. Although there is no objective data available for current DACA recipients, the USCIS released data in 2018 on the criminal history of new DACA requestors.
Of the nearly 900,000 new requests in that year, 8% of individuals had an arrest history with non-DUI driving arrests accounting for a large minority of these (~39%). Less than 8% of DACA requests with an arrest history were approved.23
Criminal Justice Statistics
The domain of criminal justice statistics is primarily defined by the FBI and Bureau of Justice Statistics, the top sources for this data. The data retained by these institutions consists of property crime and violent crime as the Drug Enforcement Administration (DEA) retains drug crime data.
In general, property crime is much more prevalent than violent crime and it is estimated that 2 in 3 property crimes go unreported and only 19% of reported property crimes are solved.
Homicides are the most consistently solved crimes, but only 70% of homicide cases were closed in 2020. Numbers are much lower for other violent crimes, such as aggravated assault (52.3%), rape (32.9%), and robbery (30.5%).22
Mass Incarceration Statistics
With over 2.3 million people imprisoned in the United States, this country has the largest worldwide prison population.22 As mass incarceration is a major driver of poverty, this is of concern to all.
Incarceration rates have increased dramatically (~500% increase) over the last several decades.19
Many concerned individuals have questioned why is the U.S. incarceration rate so high, and the shift began with the war on drugs in the 1970s and 1980s and exploded following the 2001 terrorist attacks on the U.S. and subsequent wars.10
Mass incarceration statistics indicate that the top reasons for incarceration in the United States are that marginalized areas are over-policed and individuals are receiving longer sentences for minor crimes.16 This leads to rising costs and a net loss for all with more than 80 billion dollars in government funds allocated to prison facilities annually.24
Incarceration Statistics by Race
An important aspect of incarceration statistics is how various racial groups are differentially impacted.
As noted earlier, half of all African American males are arrested before they turn 23, and 30% by age 18. In fact, there are 1,500 African American prisoners for every 100,000 individuals in this group (compared to 268/100,000 white Americans).22
Noting that less than 13% of the U.S. adult population is black, it is concerning that incarceration statistics by race show that black persons make up nearly 40% of federal inmates.12
The back end of mass incarceration and hyper-criminalization is that it widens the racial gap, significantly impacting minority populations.
Statistics on Criminal Record Discrimination
Statistics on criminal record discrimination stretch beyond the impact on employment and the discrimination impacts more than 27% of formerly incarcerated people who are unemployed. Over 5 million Americans have lost their right to vote as a result of a felony conviction.22
Additionally, lack of access to government benefits such as the Supplemental Nutrition Assistance Program (SNAP) disadvantages former convicts, and these barriers to public assistance hurt women and children the most.5
Add to that the difficulty in finding affordable housing, and the obstacles seem insurmountable. Limiting the damage to former convicts and their families is more important now than ever before.
Statistics: Employment Discrimination Based on Criminal Record
The effect of criminal records on access to employment was fleshed out in a previous section, but a further note may be made on how these barriers to employment affect various groups of individuals. Looking at the statistics, employment discrimination based on a criminal record is most likely to impact minority groups and the highest unemployment rates can be seen among black people who were formerly incarcerated.2
Furthermore, a publication by the American Enterprise Institute showed that African American males who had been arrested at least once were more likely to be unemployed than white males who had been incarcerated.10
What Goes on a Criminal Record?
Understanding what is included in a criminal record is crucial to staying on the right side of the law.
Many people are surprised to find out what is considered a criminal record, and most don’t realize that every arrest comes with a sentence, guilty or not. Not a court-ordered jail sentence necessarily, but certainly a stain on the criminal record.
According to Cornell University’s School of Industrial and Labor Relations, an individual’s criminal record is a complete history of every contact with the criminal justice system (law enforcement and courts). It includes every arrest, criminal charge, and conviction against that person.7
Some arrests never lead to charges or convictions and can still show up on the person’s record through their FBI Rap Sheet or state records. For people who have been charged but not convicted, background check for certain employment and housing can still pose a significant challenge.
Wrongful Conviction Stats
Wrongful conviction is one of the most frightening scenarios imaginable, and yet it does occur within the U.S. justice system. In fact, some wrongful conviction stats indicate that as many as 4 to 6% of imprisoned individuals are innocent.
In 2021, there were 161 exonerations. African Americans account for nearly 60% of DNA exonerations across the country.
It is estimated that African Americans are 7 times more likely to be wrongly convicted of murder than other groups, particularly when the victim is white.14,22
Denied Background Check Statistics
A criminal history check has become a regular part of many employment and housing background checks, and because of past mistakes, many individuals are turned away. Denied background check statistics aren’t easy to come by, but the FBI reports that of the 300+ million background checks conducted since 1998 by NICS for firearms purchases, more than 1.5 million were denied.
How To Remove Criminal Record From Background Check
Anyone with a significant criminal history understands how it can impact a background check. Knowing how to check criminal record online is the first step for how to remove criminal records from background checks.
While most criminal records can be found online, access is limited in some cases and information may not always be up-to-date or complete.22 The most foolproof method is to order a personal background check to find out exactly what is included on a background check.
Researching free public criminal record checks can generate some low-cost options, or use this free criminal record tool today.
How To Check if Someone Has a Criminal Record
Knowing how to find out if someone has a criminal record comes in very handy for anyone with concerns about the outcome of their own criminal history check or concerns about a little-known acquaintance. Searching public criminal records is one option for how to find someone’s criminal record, but the best way is to order a criminal background check on the individual of interest.
The criminal justice system in the US has changed over the past several decades, leading to a drastic increase in the number of incarcerated persons in this country, with the US leading the largest number of inmates worldwide. This is just one informative statistic, and this article illuminates many criminal record statistics and their relationship to race, DACA, employment, and more.
Frequently Asked Questions About Criminal Record Statistics